Grafana dynamic variables
If you want a dynamic drop down list for a dashboard the first step is to create a query variable, doing this will allow us to reuse common dashboards and allow dashboards to be clearer.
Example
Services on kubernetes are deployed to different namespaces. A dashboard will not generally span different organisations but may well use different namespaces. Also if you use the dashboard in a different organisation then the list of spaces will be different.
Variable
You should look at your data and see what labels you have available to use. This can easily be done by going to your Prometheus ( or other data source ) instance and querying back the raw data. In our example we are interested in memory_utilization so a simple selection of memory_utilization yields.
Example 1
memory_utilization{app="alertmanager-dev-get-into-teaching",exported_instance="0",guid="cdd26aed-1041-4263-9330-b541ff233df5",instance="paas-prometheus-exporter-prod-get-into-teaching.london.cloudapps.digital:443",job="PaaS Prometheus Exporter",organisation="dfe-teacher-services",space="get-into-teaching"}
2.3572323843836784
Example 2
memory_utilization{app="alertmanager-prod-get-into-teaching",exported_instance="0",guid="3fee9a22-0881-468e-8d6c-6e3b7db0b5fe",instance="paas-prometheus-exporter-prod-get-into-teaching.london.cloudapps.digital:443",job="PaaS Prometheus Exporter",organisation="dfe-teacher-services",space="get-into-teaching-monitoring"}
3.026614896953106
You can see there are some useful labels, in our case we are interested in space.
Grafana Variable
So we need to go to our dashboard and using the ‘COG’ at the top of the dashboard add a new variable. This should be a query variable and you should enter:
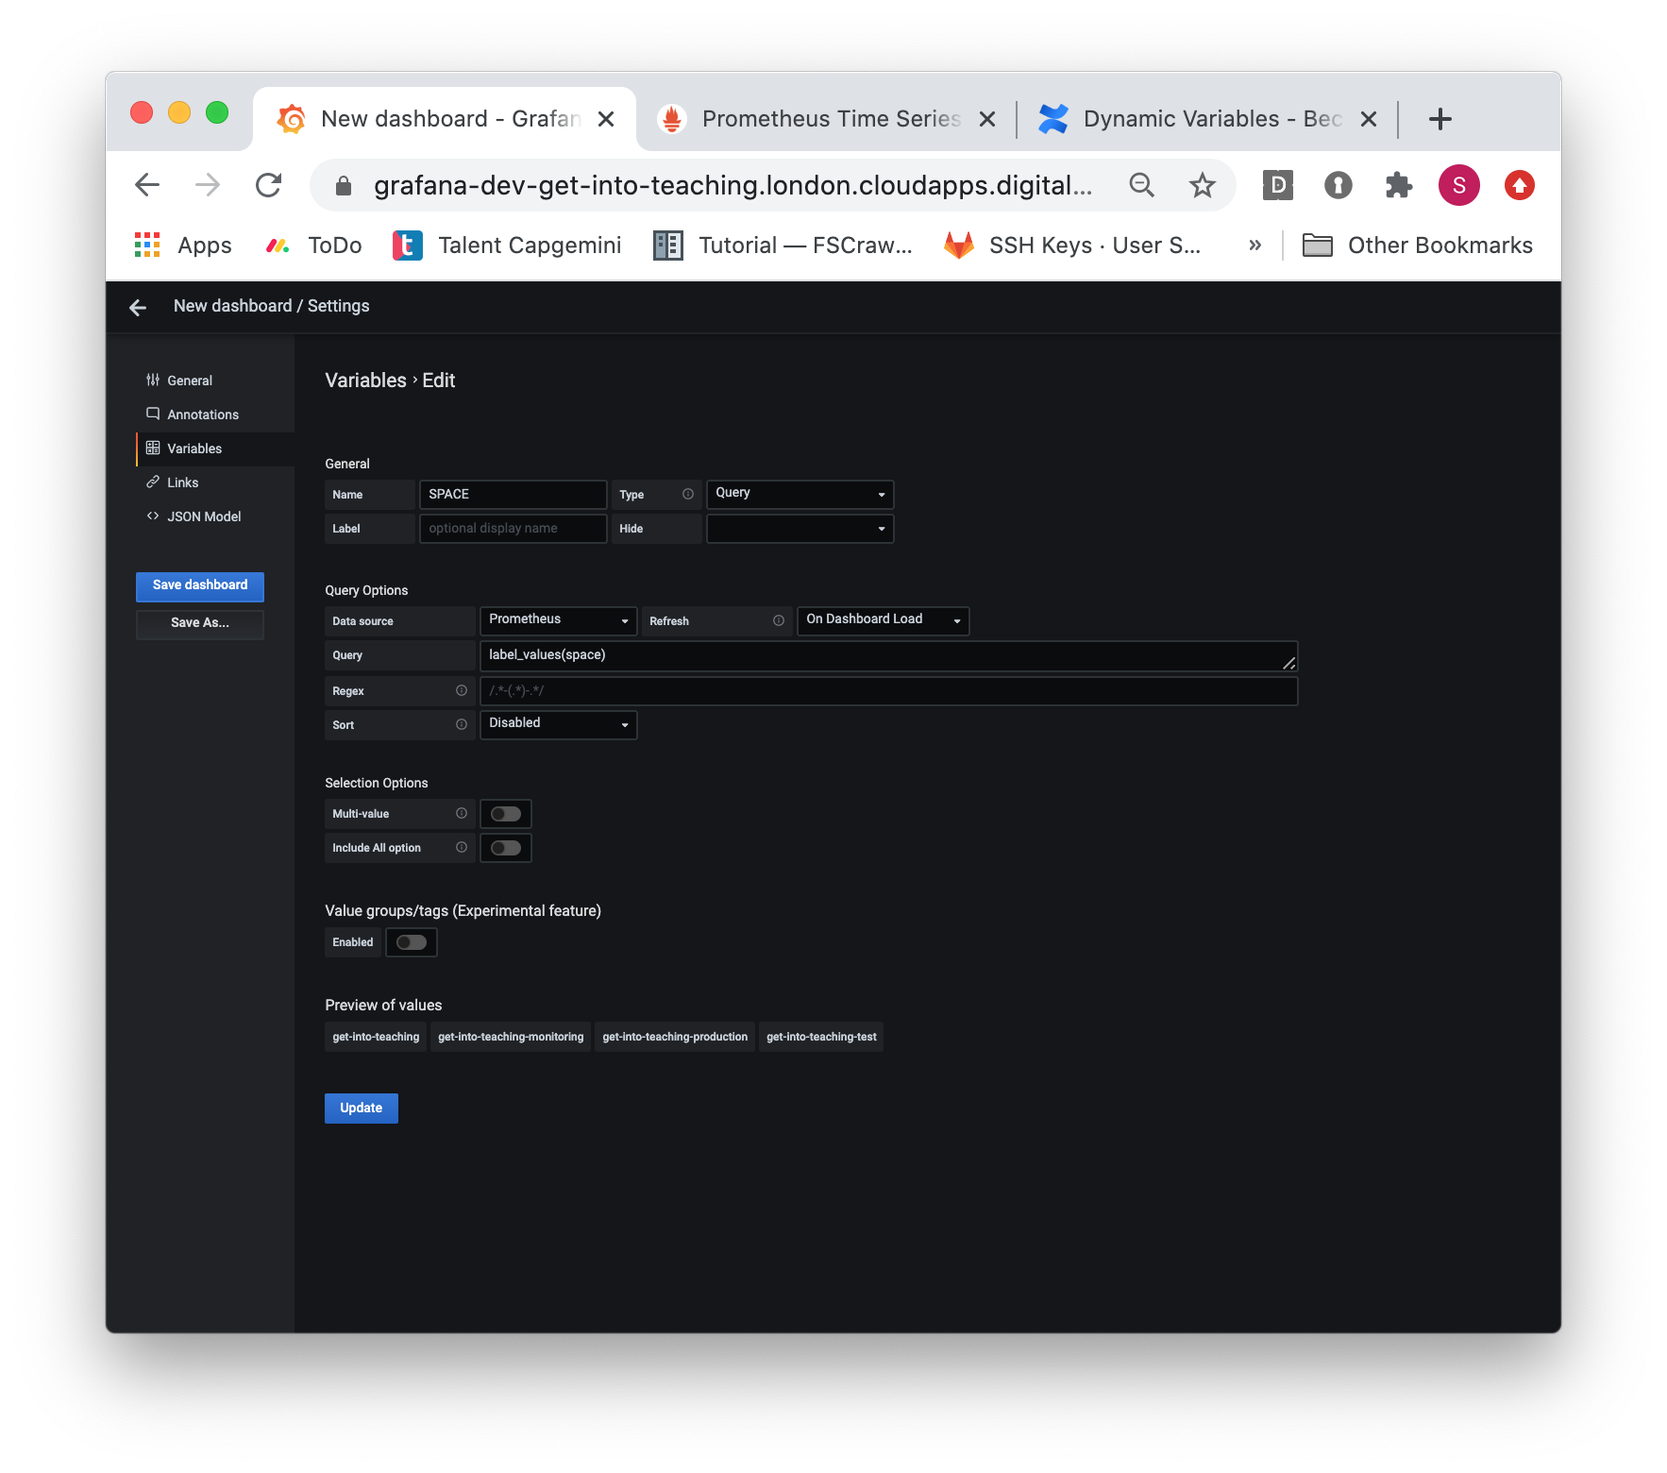
The key value is label_value(space), this returns all the labels named ‘space’ into the variable. Documentation
You should notice when you have created your variable it gives an example of the data it has returned. If this looks good, you are ready to ADD the variable.
Note that the queried label must be included in all the metrics. If not, the list may be empty. To workaround this issue, it is possible to query a particular metric which is guaranteed to return the label using the syntax label_values(metric, label). Example:
label_values(memory_utilization, space)
Using Variable
You should now notice a populated drop down list at the top of your dashboard, now it is a simple case of including the setting in your panels.